Tag Archives: tutorial

An R Tutorial: Visual Representation of Complex Multivariate Relationships Using the R qgraph Package, Part Two Repost


This is a repost of the original article that was posted as an embedded PDF file.


Douglas M. Wiig
April 8, 2018
Abstract
This article is part of my series of articles exploring the use of R
packages that allow for visualization of complex relationships among variables.
Other articles have examined visual representations produced by
the qgraph package in both large and small samples with more than three
variables.  In this article I look specifically at the R qgraph package with a small
dataset of N=10, but a large number (14) of variables. Specifically, the R
qgraph.pca function is examined.

1 The Problem

In two previous blog posts I discussed some techniques for visualizing relationships
involving two or three variables and a large number of cases. In this
tutorial I will extend that discussion to show some techniques that can be used
on datasets with complex multivariate relationships involving three or more
variables.
In this post I will use a dataset called ‘Detroit.’ This data set was originally
used in the book ‘Subset selection in regression’ by Alan J. Miller published in
the Chapman and Hall series of monographs on Statistics and Applied Probability,
no. 40. It was also used in other research and appeared in appendix A
of ‘Regression analysis and its application: A data-oriented approach’ by Gunst
and Mason, Statistics textbooks and monographs no. 24, Marcel Dekker. Editor.
The Detroit dataset contains 14 variables and 10 cases. Each case represents
a year during the time period 1961-1973. The variables on which data was
collected are seen as possible predictors of homicide rate in Detroit during each
of the years studied.
These data are shown below

FTP UEMP MAN LIC GR CLEAR WM NMAN GOV HE WE HOM ACC ASR
260.35 11.0 455.5 178.15 215.98 93.4 558724. 538.1 133.9 2.98 117.18 8.60 9.17 306.18
269.80 7.0 480.2 156.41 180.48 88.5 538584. 547.6 137.6 3.09 134.02 8.90 40.27 315.16
272.04 5.2 506.1 198.02 209.57 94.4 519171. 562.8 143.6 3.23 141.68 8.52 45.31 277.53
272.96 4.3 535.8 222.10 231.67 92.0 500457. 591.0 150.3 3.33 147.98 8.89 49.51 234.07
272.51 3.5 576.0 301.92 297.65 91.0 482418. 626.1 164.3 3.46 159.85 13.0 55.05 30.84
261.34 3.2 601.7 391.22 367.62 87.4 465029. 659.8 179.5 3.60 157.19 14.57 53.90 17.99
268.89 4.1 577.3 665.56 616.54 88.3 448267. 686.2 187.5 3.73 155.29 21.36 50.62 86.11
295.99 3.9 596.9 1131.21 1029.75 86.1 432109. 699.6 195.4 2.91 131.75 28.03 51.47 91.59
319.87 3.6 613.5 837.60 786.23 79.0 416533. 729.9 210.3 4.25 178.74 31.49 49.16 20.39
341.43 7.1 569.3 794.90 713.77 73.9 401518. 757.8 223.8 4.47 178.30 37.39 45.80 23.03

The variables are as follows:
FTP – Full-time police per 100,000 population
UEMP – % unemployed in the population
MAN – number of manufacturing workers in thousands
LIC – Number of handgun licenses per 100,000 population
GR – Number of handgun registrations per 100,000 population
CLEAR – % homicides cleared by arrests
WM – Number of white males in the population
NMAN – Number of non-manufacturing workers in thousands
GOV – Number of government workers in thousands
HE – Average hourly earnings
WE – Average weekly earnings
HOM – Number of homicides per 100,000 of population
ACC – Death rate in accidents per 100,000 population
ASR – Number of assaults per 100,000 population
[J.C. Fisher ”Homicide in Detroit: The Role of Firearms”, Criminology, vol.14,
387-400 (1976)]

2 Analysis
As I have noted in previous tutorials, social science research projects often start
out with many potential independent predictor variables for a given dependent
variable. If these are all measured at the interval or ratio level, a correlation
matrix often serves as a starting point to begin analyzing relationships among
variables. In this particular case a researcher might be interested in looking at
factors that are related to total homicides. There are many R techniques to
enter data for analysis. In this case I entered the data into an Excel spreadsheet
and then loaded the file into the R environment. Install and load the following
packages:
Hmisc
stats
qgraph
readxl (only needed if importing data from Excel)

A correlation matrix can be generated using the cor function which is contained
in the stats package. To produce a matrix using all 14 variables use the
following code:
#the data file has been loaded as ’detroit’
#the file has 14 columns
#run a pearson correlation and #run a pearson correlation and put into the object ’detcor’
detcor=cor(as.matrix(detroit[c(1:14)]), method=”pearson”)
#
#round the correlation matrix to 2 decimal places for better viewing
round(detcor, 2)
#
#The resulting matrix will be displayed on the screen

Examination of the matrix shows a number of the predictors correlate with the
dependent variable ’HOM.’ There are also a large number of inter-correlations
among the predictor variables. This fact makes it difficult to make any generalizations
based on the correlation matrix only. As demonstrated in previous
tutorials, the qgraph function can be used to produce a visual representation of
the correlation matrix. Use the following code:

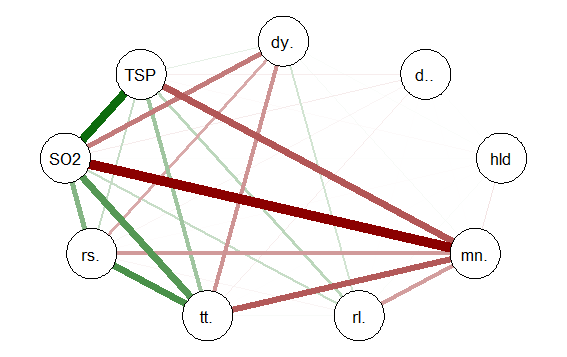
#basic graph with 14 vars zero order correlations
qgraph(detcor, shape=”circle”, posCol=”darkgreen”, negCol=”darkred”, layout=”spring”)

This will produce graph as seen below:

qgraphplot1

The graph displays positive correlations among variable as a green line, and
negative as a red line. The color intensity indicates the relative strength of the
correlation. While this approach provides an improvement over the raw matrix
it still rather difficult to interpret. There are many options other than those
used in the above example that allow qgraph to have a great deal of flexibility in
creating visual representation of complex relationships among variables. In the
next section I will examine one of these options that uses principal component
analysis of the data.
2.1 Using qgraph Principal Component Analysis
A discussion of the theory behind principal component exploratory analysis is
beyond the scope of this discussion. Suffice it to say that it allows for simplification
of a large number of inter-correlations by identifying factors or dimensions
that individual correlations relate to. This grouping of variables on specific factors
allows qgraph to create a visual representation of these relationships. An
excellent discussion of the theory of PCA along with R scripts can be found in
Principal Components Analysis (PCA), Steven M. Holland Department of Geology,
University of Georgia, Athens, GA, 2008.
To produce a graph using the ’detcor’ correlation matrix used above use the
following code:

#correlation matrix used is ’detcor’
#qgraph with loadings from principal components
#basic options used; many other options available
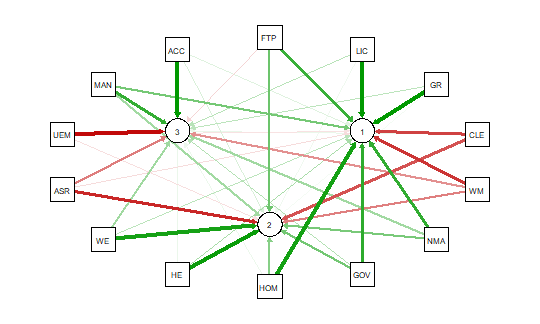
qgraph.pca(detcor, factor=3, rotation=”varimax”)
#this will yield 3 factors
This code produces the output shown below:

pcaplot

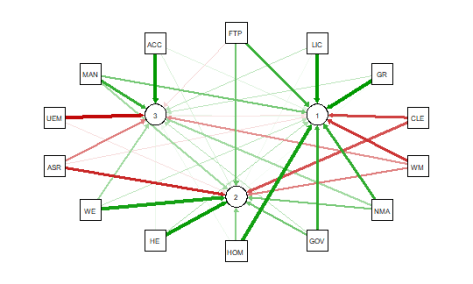
As noted above the red and green arrows indicate negative and positive loadings
on the factors, and the color intensity indicates the strength. The qgraph.pca
function produces a useful visual interpretation of the clustering of variables relative
to the three factors extracted. This would be very difficult if not impossible
with only the correlation matrix or the basic qgraph visual representation.
In a future tutorial I will explore more qgraph options that can be used to
explore the Detroit dataset as well as options for a larger datasets. In future
articles I will also explore other R packages that are also useful for analyzing
large numbers of complex variable interrelationships in very large, medium, and
small samples.
** When developing R code I strongly recommend using an IDE such as
RStudio. This is a powerful coding environment and is free for personal use as
well as being open source software. RStudio will run on a variety of platforms.
If you are developing code for future publication or sharing I would also recommend
TeXstudio, a LaTex based document development environment which is also free for personal use. This document was produced using TeXstudio 2.12.6
and RStudio 1.0.136.


An R Tutorial: Visual Representation of Complex Multivariate Relationships Using the R ‘qgraph’ Package, Part Two


An R programming tutorial by D.M. Wiig

This post is contained in a .pdf document.  To access the document click on the green link shown below.

qgraphpost3

The R qgraph Package: Using R to Visualize Complex Relationships Among Variables in a Large Dataset, Part One


The R qgraph Package: Using R to Visualize Complex Relationships Among Variables in a Large Dataset, Part One

A Tutorial by D. M. Wiig, Professor of Political Science, Grand View University

In my most recent tutorials I have discussed the use of the tabplot() package to visualize multivariate mixed data types in large datasets. This type of table display is a handy way to identify possible relationships among variables, but is limited in terms of interpretation and the number of variables that can be meaningfully displayed.

Social science research projects often start out with many potential independent predictor variables for a given dependant variable. If these variables are all measured at the interval or ratio level a correlation matrix often serves as a starting point to begin analyzing relationships among variables.

In this tutorial I will use the R packages SemiPar, qgraph and Hmisc in addition to the basic packages loaded when R is started. The code is as follows:

###################################################
#data from package SemiPar; dataset milan.mort
#dataset has 3652 cases and 9 vars
##################################################
install.packages(“SemiPar”)
install.packages(“Hmisc”)
install.packages(“qgraph”)
library(SemiPar)
####################################################

One of the datasets contained in the SemiPar packages is milan.mort. This dataset contains nine variables and data from 3652 consecutive days for the city of Milan, Italy. The nine variables in the dataset are as follows:

rel.humid (relative humidity)
tot.mort (total number of deaths)
resp.mort (total number of respiratory deaths)
SO2 (measure of sulphur dioxide level in ambient air)
TSP (total suspended particles in ambient air)
day.num (number of days since 31st December, 1979)
day.of.week (1=Monday; 2=Tuesday; 3=Wednesday; 4=Thursday; 5=Friday; 6=Saturday; 7=Sunday
holiday (indicator of public holiday: 1=public holiday, 0=otherwise
mean.temp (mean daily temperature in degrees celsius)

To look at the structure of the dataset use the following

#########################################
library(SemiPar)
data(milan.mort)
str(milan.mort)
###############################################

Resulting in the output:

> str(milan.mort)
‘data.frame’: 3652 obs. of 9 variables:
$ day.num : int 1 2 3 4 5 6 7 8 9 10 …
$ day.of.week: int 2 3 4 5 6 7 1 2 3 4 …
$ holiday : int 1 0 0 0 0 0 0 0 0 0 …
$ mean.temp : num 5.6 4.1 4.6 2.9 2.2 0.7 -0.6 -0.5 0.2 1.7 …
$ rel.humid : num 30 26 29.7 32.7 71.3 80.7 82 82.7 79.3 69.3 …
$ tot.mort : num 45 32 37 33 36 45 46 38 29 39 …
$ resp.mort : int 2 5 0 1 1 6 2 4 1 4 …
$ SO2 : num 267 375 276 440 354 …
$ TSP : num 110 153 162 198 235 …

As is seen above, the dataset contains 9 variables all measured at the ratio level and 3652 cases.

In doing exploratory research a correlation matrix is often generated as a first attempt to look at inter-relationships among the variables in the dataset. In this particular case a researcher might be interested in looking at factors that are related to total mortality as well as respiratory mortality rates.

A correlation matrix can be generated using the cor function which is contained in the stats package. There are a variety of functions for various types of correlation analysis. The cor function provides a fast method to calculate Pearson’s r with a large dataset such as the one used in this example.

To generate a zero order Pearson’s correlation  matrix use the following:

###############################################
#round the corr output to 2 decimal places
#put output into variable cormatround
#coerce data to matrix

#########################################
library(Hmisc)
cormatround round(cormatround, 2)
#################################################

The output is:

> cormatround > round(cormatround, 2)
Day.num day.of.week holiday mean.temp rel.humid tot.mort resp.mort  SO2   TSP
day.num     1.00       0.00    0.01      0.02      0.12    -0.28  0.22 -0.34  0.07
day.of.week    0.00       1.00    0.00      0.00      0.00    -0.05  0.03 -0.05 -0.05
holiday        0.01       0.00    1.00     -0.07      0.01     0.00  0.01  0.00 -0.01
mean.temp      0.02       0.00   -0.07      1.00     -0.25    -0.43 -0.26 -0.66 -0.44
rel.humid      0.12       0.00    0.01     -0.25      1.00     0.01 -0.03  0.15  0.17
tot.mort      -0.28      -0.05    0.00     -0.43      0.01     1.00  0.47  0.44  0.25
resp.mort     -0.22      -0.03   -0.01     -0.26     -0.03     0.47  1.00  0.32  0.15
SO2           -0.34      -0.05    0.00     -0.66      0.15     0.44  0.32  1.00  0.63
TSP            0.07      -0.05   -0.01     -0.44      0.17     0.25  0.15  0.63  1.00
>

The matrix can be examined to look at intercorrelations among the nine variables, but it is very difficult to detect patterns of correlations within the matrix.  Also, when using the cor() function raw Pearson’s coefficients are reported, but significance levels are not.

A correlation matrix with significance can be generated by using the rcorr() function, also found in the Hmisc package. The code is:

#############################################
library(Hmisc)
rcorr(as.matrix(milan.mort, type=”pearson”))
###################################################

The output is:

> rcorr(as.matrix(milan.mort, type="pearson"))
           day.num day.of.week holiday mean.temp rel.humid tot.mort resp.mort   SO2   TSP
day.num       1.00       0.00    0.01      0.02      0.12    -0.28  -0.22 -0.34  0.07
day.of.week   0.00        1.00    0.00      0.00      0.00    -0.05 -0.03 -0.05 -0.05
holiday       0.01        0.00    1.00     -0.07      0.01     0.00 -0.01  0.00 -0.01
mean.temp     0.02        0.00   -0.07      1.00     -0.25    -0.43 -0.26 -0.66 -0.44
rel.humid     0.12        0.00    0.01     -0.25      1.00     0.01 -0.03  0.15  0.17
tot.mort     -0.28       -0.05    0.00     -0.43      0.01     1.00  0.47  0.44  0.25
resp.mort    -0.22       -0.03   -0.01     -0.26     -0.03     0.47  1.00  0.32  0.15
SO2          -0.34       -0.05    0.00     -0.66      0.15     0.44  0.32  1.00  0.63
TSP           0.07       -0.05   -0.01     -0.44      0.17     0.25  0.15  0.63  1.00

n= 3652 


P
            day.num day.of.week holiday mean.temp rel.humid tot.mort resp.mort SO2    TSP   
day.num             0.9771     0.5349   0.2220    0.0000    0.0000  0.0000  0.0000
day.of.week 0.9771              0.7632  0.8727    0.8670    0.0045  0.1175   0.0061
holiday     0.5349  0.7632              0.0000    0.4648    0.8506  0.6115    0.7793 0.4108
mean.temp   0.2220  0.8727      0.0000            0.0000    0.0000  0.0000    0.0000 0.0000
rel.humid   0.0000  0.8670      0.4648  0.0000              0.3661  0.1096    0.0000 0.0000
tot.mort    0.0000  0.0045      0.8506  0.0000    0.3661            0.0000    0.0000 0.0000
resp.mort   0.0000  0.1175      0.6115  0.0000    0.1096    0.0000            0.0000 0.0000
SO2         0.0000  0.0024      0.7793  0.0000    0.0000    0.0000  0.0000           0.0000
TSP         0.0000  0.0061      0.4108  0.0000    0.0000    0.0000  0.0000    0.0000       
>

In a future tutorial I will discuss using significance levels and correlation strengths as methods of reducing complexity in very large correlation network structures.

The recently released package qgraph () provides a number of interesting functions that are useful in visualizing complex inter-relationships among a large number of variables. To quote from the CRAN documentation file qraph() “Can be used to visualize data networks as well as provides an interface for visualizing weighted graphical models.” (see CRAN documentation for ‘qgraph” version 1.4.2. See also http://sachaepskamp.com/qgraph).

The qgraph() function has a variety of options that can be used to produce specific types of graphical representations. In this first tutorial segment I will use the milan.mort dataset and the most basic qgraph functions to produce a visual graphic network of intercorrelations among the 9 variables in the dataset.

The code is as follows:

###################################################
library(qgraph)
#use cor function to create a correlation matrix with milan.mort dataset
#and put into cormat variable
###################################################
cormat=cor(milan.mort)  #correlation matrix generated
###################################################
###################################################
#now plot a graph of the correlation matrix
###################################################
qgraph(cormat, shape=”circle”, posCol=”darkgreen”, negCol=”darkred”, layout=”groups”, vsize=10)
###################################################

This code produces the following correlation network:

The correlation network provides a very useful visual picture of the intercorrelations as well as positive and negative correlations. The relative thickness and color density of the bands indicates strength of Pearson’s r and the color of each band indicates a positive or negative correlation – red for negative and green for positive.

By changing the “layout=” option from “groups” to “spring” a slightly different perspective can be seen. The code is:

########################################################
#Code to produce alternative correlation network:
#######################################################
library(qgraph)
#use cor function to create a correlation matrix with milan.mort dataset
#and put into cormat variable
##############################################################
cormat=cor(milan.mort) #correlation matrix generated
##############################################################
###############################################################
#now plot a circle graph of the correlation matrix
##########################################################
qgraph(cormat, shape=”circle”, posCol=”darkgreen”, negCol=”darkred”, layout=”spring”, vsize=10)
###############################################################

The graph produced is below:

Once again the intercorrelations, strength of r and positive and negative correlations can be easily identified. There are many more options, types of graph and procedures for analysis that can be accomplished with the qgraph() package. In future tutorials I will discuss some of these.

Using R: Random Sample Selection and One-Way ANOVA


A tutorial by Douglas M. Wiig

In the previous tutorial we looked at the hypothesis that one’s outlook on life is influenced by the amount of education attained. Using the GSS 2014 data file we looked at the education variable ‘educ’, and the outlook on life variable ‘life’, a measure of outlook on life as ‘DULL’, ‘ROUTINE’, or ‘EXCITING.’ We selected a subset for each response category and found that there appeared to be
differences among the mean level of education measured in years for each of the categories of outlook on life. To further examine this we will first randomly select a sample from the data file, look at the
mean education for each category of outlook on life, and evaluate the means using simple one-way ANOVA.

To randomly select a sample from a population of values we can use the sample() function. There are a number of options and variations of the function that are beyond the scope of this tutorial. Since the
variable ‘educ’ is measured in years we can use the sample.int() function which is designed for use with integer values. The general format of the function is:

sample.int(n, size = n, replace = FALSE)

where: n = the size of population the sample is from
size = the size of the sample
replace = FALSE if sampling without replacement; TRUE if sampling with replacement

For this example I will select a sample of n=500 without replacement from the data file containing a total of 2538 cases. The sample data is loaded into a data matrix as it is selected. This will be
accomplished in two steps. In the first step we will load the sample.int() function with the values to use for selecting the sample and put the vector in ‘randsamp2. The code is:

randsamp2 <- sample.int(2538, size=500, replace=FALSE)

To select the sample make sure that make sure that the GSS2014 data file is loaded into the R environment. I previously loaded the data file into a data frame ‘gss14.’  To select the sample and load
it into a data frame ‘randgss2’ the code is:

randgss2 <- gss14[randsamp2,]

Once the sample has been generated we can look at the mean years of education for each of the three responses for outlook on life. We do this by selecting a subset for each response. Use the following
code:

###################################################
#look at educ means by life by selecting 3 subsets from randgss2
###################################################
life12 <- subset(randgss2, life == “DULL”, select=educ)
life22 <- subset(randgss2, life == “ROUTINE”, select=educ)
life32 <- subset(randgss2, life == “EXCITING”, select=educ)

Now run summary statistics for each subset to look at the means:

summary(life12)
summary(life22)
summary(life32)

We can now see that the means are as follows:

life12 = 13.0
life22 = 13.29
life 32 = 14.51

and we can generate a summary visual of the differences among the three subsets by doing a simple boxplot using:

###################################################
# do boxplots of the subsets to visualize differences
#boxplot using educ and life variables from the ‘randgss2’ data #frame
###################################################
boxplot(randgss2$educ ~ randgss2$life, main=”Education and View on Life n = 500″, xlab=”View of Life”,ylab=”Years of Education”)

The following graph will result:

Rplotrandgss2

As can be seen above there does appear to be a difference among these means, particularly for those who see life as ‘DULL.’ To see if these differences are significant an ANOVA will be run using the
simple one way ANOVA function aov(). The basic function is:
aov(formula, data = NULL)For our example we use:

model2 <- aov(educ ~ life, data=randgss2)

which analyzes the mean education by category of outlook on life using the randgss2 sample of n=500. The results are stored in ‘model2.’ The output from this operation is shown using the summary() function. This produces the following output:

summary(model2)

Df Sum Sq Mean Sq F value Pr(>F) life
2  171.5    85.77     10.42 4.08e-05 ***
Residuals  332     2732.2  8.23

Signif. codes: 0 ‘***’ 0.001 ‘**’ 0.01 ‘*’ 0.05 ‘.’ 0.1 ‘ ’ 1
165 observations deleted due to missingness

This output shows that at least one of the means differs significantly from the others. To test this difference further we can use a pair-wise comparison of means to see which means differ significantly
from each other. There are several options available. We will use a basic Tukey HSD comparison. This is accomplished using:

##################################################
#run HSD on sample
TukeyHSD(model2)
##################################################

producing the following output:

Tukey multiple comparisons of means
95% family-wise confidence level

Fit: aov(formula = educ ~ life, data = randgss2, projections = TRUE)

$life                               diff                     lwr                upr                    p adj
ROUTINE-EXCITING -1.074404 -1.833686 -0.31512199  .0027590
DULL-EXCITING          -2.729412 -4.447386 -1.01143754  .0006325
DULL-ROUTINE           -1.655008 -3.384551 0.07453525 00640910

By looking at the p value for each comparison it can be seen that both the ROUTINE-EXCITING and DULL-EXCITING means differ significantly at p ≤ .05

I might point out that if a researcher was using the GSS 2014 data file as we used here there would need to be more data preparation prior to running any analysis. For example, there is a fair amount of
missing data as indicated by NA in the raw data file. The missing data would need to be handled in some way. R has numerous functions and packages that can assist in resolving missing data issues of
various types, but a discussion of these is a subject for a future tutorial.
8/7/15                   Douglas M. Wiig                    http://dmwiig.net

Tutorial: Using R to Analyze NORC GSS Social Science Data, Part Six, R and ANOVA


Tutorial: Using R to Analyze NORC GSS Social Science Data, Part Six, R and ANOVA

A tutorial by Douglas M. Wiig

As discussed in previous segments of this tutorial, for anyone interested in researching social science questions there is a wealth of survey data available through the National Opinion Research Center (NORC) and its associated research universities. The Center has been conducting a national survey each year since 1972 and has compiled a massive database of data from these surveys. Most if not all of these data files can be accessed and downloaded without charge. I have been working with the 2014 edition of the data and for all part of this tutorial will use the GSS2014 data file that is available for download on the Center’s web site. (See the NORC main website at http://www.norc.org/Research/Projects/Pages/general-social-survey.aspx and at http://www3.norc.org/GSS+Website ).

Accessing and loading the NORC GSS2014 data set was discussed in part one of this tutorial. Refer to it if you need specific information on downloading the data set in STATA or SPSS format.  In this segment we will use the subset function to select a desired set of cases from all of the cases in the data file that meet certain criteria.  As indicated in my previous tutorial the GSS2014 data set contains a
total of 2588 cases and 866 variables.

Before starting this segment of the tutorial be sure that the foreign
package is installed and loaded into your R session. As I have indicated in previous tutorials, use of an IDE such as R Studio greatly facilitates entering and debugging R code when doing research such as is discussed in my tutorials.  

Import the GSS 2014 data file in SPSS format and load it into the data frame ‘gss14’ using:
#########################################################import  GSS2014 file in SPSS .sav format
#uses foreign package
########################################################require(foreign)
gss14<- read.spss("/path to your location/GSS2014.sav",                      use.value.labels=TRUE,max.value.labels=Inf, to.data.frame=TRUE)
#################################################

In this tutorial the analysis of this sample will focus on examining the hypothesis “An individual’s outlook on life is influenced by the amount of education the person has attained.” The GSS variables ‘educ’, education in number of years and ‘life’, whether the respondent rated life DULL, ROUTINE, or EXCITING. A simple approach to testing this hypothesis is to compare mean levels of education for each of the three categories of response. I will do this analysis in two stages. In the first stage I will use techniques discussed in a previous tutorial to select a subset of each response category and display the mean education level for each of the three categories.

The three subsets life1, life2, and life3 are generated using the following code:

###################################################
# create 3 subsets from gss14 view on life by years of education
##################################################

life1 <- subset(gss14, life == “DULL”, select=educ)

life2 <- subset(gss14, life ==”ROUTINE”, select=educ)

life3 <- subset(gss14, life == “EXCITING”, select=educ)

###################################################

#The three means of the subsets are displayed using the code:

# run summary statistics for each subgroup

##################################################

summary(life1)

summary(life2)

summary(life3)

###################################################

resulting the following output:
educ
Min. : 0.00
1st Qu.:10.00
Median :12.00
Mean :11.78
3rd Qu.:13.00
Max. :20.00

summary(life2)
educ
Min. : 0.00
1st Qu.:12.00
Median :13.00
Mean :13.22
3rd Qu.:16.00
Max. :20.00
NA’s :1

summary(life3)
educ
Min. : 2.00
1st Qu.:12.00
Median :14.00
Mean :14.31
3rd Qu.:16.00
Max. :20.00

As is seen above there does appear to be a difference among mean years of education and the corresponding outlook on life. In order to examine whether or not these observed differences are not due to chance a simple one-way Analysis of Variance can be generated.

In the next tutorial I will discuss performing the ANOVA and using pair-wise comparisons to determine which if any means are different.

R Tutorial: Using R to Analyze the NORC GSS2014 Database, Selecting Subsets and Comparing Means Using Student’s t Test


R Tutorial Part Three: Selecting Subsets and Comparing Means Using an Independent Sample t Test

A tutorial by Douglas M. Wiig

As discussed in previous segments of this tutorial, for anyone interested in researching social science questions there is a wealth of survey data available through the National Opinion Research Center (NORC) and its associated research universities. The Center has been conducting a national survey each year since 1972 and has compiled a massive database of data from these surveys. Most if not all of these data files can be accessed and downloaded without charge. I have been working with the 2014 edition of the data and for all part of this tutorial will use the GSS2014 data file that is available for download on the Center’s web site. (See the NORC main website at http://www.norc.org/Research/Projects/Pages/general-social-survey.aspx and at http://www3.norc.org/GSS+Website ).

Accessing and loading the NORC GSS2014 data set was discussed in part one of this tutorial. Refer to it if you need specific information on downloading the data set in STATA or SPSS format.  In this segment we will use the subset function to select a desired set of cases from all of the cases in the data file that meet certain criteria.  As indicated in my previous tutorial the GSS2014 data set contains a total of 2588 cases and 866 variables.
Before starting this segment of the tutorial be sure that the foreign package is installed and loaded into your R session.  Import the GSS 2014 data file and load it into the data frame ‘Dataset’ using:

########################################################
#import GSS2014 file in SPSS .sav format
#uses foreign package
########################################################
require(foreign)
Dataset <- read.spss("/path to your location/GSS2014.sav", 
                     use.value.labels=TRUE, max.value.labels=Inf, to.data.frame=TRUE)

###########################################################

In the previous segment of this tutorial we started to investigate whether or not an individual’s education had an effect on their response to a NORC survey item dealing with abortion. The item asked respondents to either ‘AGREE’ or ‘DISAGREE’ with the statement ‘A women should be allowed to obtain an abortion under any circumstances.’ We selected a subset of all of the respondents who answered ‘AGREE’ and a second subset of all the respondents who answered ‘DISAGREE’ using the following code:

##############################################

#select subset from Dataset and write to data frame SS1

###################################################
SS1 <- subset(Dataset, abany == "YES", select=educ)

View(SS1)

#######################################################

######################################################
#select subset from Dataset and write to data frame SS2
######################################################
SS2 <- subset(Dataset, abany == "NO", select=educ)
View(SS2)

A mean number of years of education can be calculated for each of the subsets using the following:

#calculate descriptive statistics for SS1 and SS2

####################################################

summary(SS1)

summary(SS2)

####################################################

Output from the above for SS1 is:

> summary(SS1)

educ

Min. : 0.0

1st Qu.:12.0

Median :15.0

Mean :14.6

3rd Qu.:16.0

Max. :20.0

Output for SS2 is:

> summary(SS2)

educ

Min. : 0.00

1st Qu.:12.00

Median :12.00

Mean :12.93

3rd Qu.:15.00

Max. :20.00

NA’s :1

As seen above there is a difference in mean years of education for the two subsets. We can use a two independent sample t test to determine whether or not the difference is large enough to not be due to chance.

In this tutorial I will use the Student’s t test function t.test that is found in the stats package. The function is used in the following form:

t.test =(x,y, alternative = c(“two.sided”, “less”, “greater”), mu=0, paired = FALSE, var.equal = FALSE, conf.level = .95)

where x and y = numeric vectors of data values

alternative = specification of a one-tailed or two-tailed test

mu = 0 specification that true difference between means is zero

paired = FALSE specification of a two independent sample test; if TRUE a paired samples test will be used

var.equal = specification of equal variances of the two samples; if TRUE the pooled variance is used otherwise a Welsh approximation of degrees of freedom is used

conf.level = confidence level of the interval

For further information see the documentation in CRAN help files for the function t.test().

Using the vectors selected from the dataset SS1, and SS2 the t test is performed using:

###########################################################

#perform a t test to compare sample means

#########################################################

t.test(SS1,SS2, alternative = c(“two.sided”), mu=0, paired=FALSE, var.equal = TRUE, conf.level = .95)

###########################################################

Resulting in output of:

        Two Sample t-test

data:  SS1 and SS2 
t = 11.1356, df = 1650, p-value < 2.2e-16
alternative hypothesis: true difference in means is not equal to 0 
95 percent confidence interval:
 1.369673 1.955333 
sample estimates:
mean of x mean of y 
 14.59517  12.93267 

We can see that the difference between the mean years of education for the ‘YES’ and the ‘NO’ samples is significant at an alpha level of p=.05. Subsets can also be used to compare means involving more than two samples and using simple one-way Analysis of Variance. This will be covered in the next part of the tutorial.