Tag Archives: linux

Take Your R Projects on the Road: Using R on Your Raspberry Pi, Android Device, and iPhone


I continue to complete work on my next post on using the R wordcloud package.  As I normally do programming and wrting with my Lenovo desktop computer, I decided to experiment with installing R-base and RStudio on my Raspberry Pi Model 3B and tablet computer for those occasions when I desire to work while traveling.    The Raspberry Pi is running the latest version of Debian Trixie along with the Raspberry Pi desktop. The tablet is using the latest version of Android 16. My first observation relates to the availability of R for these platforms.

I. Installing R-base and RStudio on Raspberry Pi3/B,4,5

R is available for a variety of UNIX, Windows, and MacOS systems. If you are running R on Windows, you are familiar with the 32- and 64-bit versions available for download and installation via an executable loader. While the R-base console has been available for the RPi platform, it has only been recently that the RStudio-server has been available for the ARM64 processor used in the RPi 3A/B, 4, and 5 models. I am currently using Debian Trixie 64-bit on my RPi 3/B. The R-base package is now available in Debian repositories so R can be installed via the RPi desktop menu rather than downloading binary builds or executable files.

For an RPi 3B or higher I would recommend the following:
-Make sure your microSD card is large enough. I am using a 32 GB card.
-Make sure your OS is up to date. Use the command line utility to run the following commands:
       sudo apt update (respond to prompts that follow)
       sudo apt full-upgrade (respond the prompts)
Depending on the model of RPi you are using, the memory card size and Debian version you are using this update could take quite some time.

Once the update is completed use the desktop menu to access the add/delete software option, search for the R package using r-base as the keyword and click on the appropriate icon to start the installation. When the installation is complete you should see the R icon in the desktop dropdown menu under the Programming or Science (or both) headings. The R-base console can now be run by clicking the menu icon, and R is now available for access by RStudio-server if it is installed.

Because the RPi uses an ARM processor, RStudio itself cannot be installed, but RStudio-server has been successfully ported to the platform. Additional information on R downloads can be found at the Posit web site RStudio IDE User Guide RStudio User Guide, and at the link RStudio Latest Builds. If you wish to install the RStudio-server from your RPi command line utility there are several steps, but the result is a working web-based interface with full RStudio-server build. Follow the steps listed below.
1. When installing new software run an update using:
     sudo apt update
2. The port of RStudio-server we are installing was designed for the Ubuntu OS so install dependencies needed for Debian using:
     sudo apt install gdebi-core libssl-dev libclang-dev
3. Get the build from the Posit Daily Builds library using 

wget https://dl.dailies.rstudio.com/server/jammy/arm64/rstudio-       server-2026.06.0-242-arm64.deb
4. Install the application using:
 sudo gdebi rstudio-server-2026.06.0-242-arm64.deb
5. When the installation is complete use the system service command to start RStudio-server with:
     sudo systemctl start rstudio-server (for the current  bootup)                                             and/or
     sudo systemctl enable rstudio-server (start at all bootups)
6. Open the Chromium or Firefox web browser from the desktop menu and access the RStudio-server by entering the URL:
      http://<RPi IP address on your network>:8787
In my case I would enter http://192.168.4.115:8787
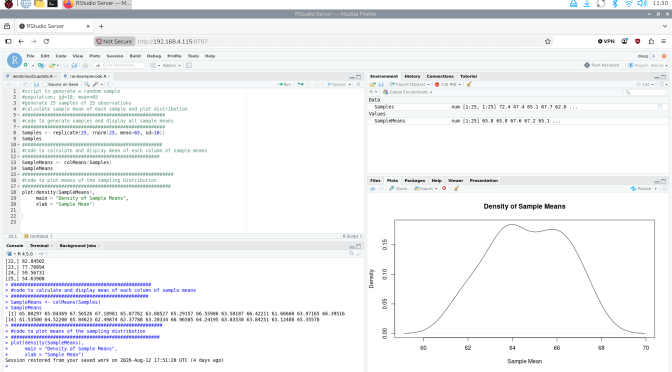
The screenshot shown below shows RStudio with the code from this article and the resulting output.

<Screenshot can be viewed in the PDF version of this document>

II. Using R on an Android Device

R and RStudio will not port directly to an Android based OS, but there are a few applications that will work with varying degrees of utility. I have a tablet that runs Android 16 and am using a free application, Rlytic,. Once installed from the Play Store users sign up with a username and password. When the program starts, a code entry console is displayed. Your code can be entered directly using the on-screen keyboard provided or can be loaded from your device file storage or cloud storage. The interface is easy to use. I have included a simple program example and some screenshots below.
Rlytic is free to use but is restricted to having only 2 programs active at a time. An unlimited version is available for purchase. I might also add that at the time of this writing Rlytic is running on R-base v.3 so users may run into some problems with more complex projects.

III. Using R on an iPhone

I currently use an iPhone 12 and was curious about any R applications that would work with it. I found an application called WebR which combines R-base 4.xxx with a text editor and browser interface. According to the program s author the application was designed for use by students in a classroom setting when learning statistics and/or R programming. It provides a highly mobile platform for Running R programs and quickly generates both text and graphics output. Once again, I will leave it to readers to engage the application s learning curve and will provide a simple example and screenshots below. The software is free and is available in the iPhone App Store.

IV. Sample Program: Raspberry Pi

The following code is a simple example of how R can be used to demonstrate the Central Limit Theorem in sampling from a population. The code uses the R-base rnorm function to generate randomly selected samples from a normally distributed population of values with a given population mean and standard deviation, finds the mean of each sample generated and graphs the sampling distribution. The code is shown below.

#population; sd=10; mean=65
#generate 25 samples of 25 observations
#calculate sample mean of each sample and plot distribution
###################################################
#code to generate samples and display all sample means
###################################################
Samples <- replicate(25, rnorm(25, mean=65, sd=10))
Samples #show the samples generated
##################################################
#code to calculate and display mean of each column of sample means
#################################################
SampleMeans <- colMeans(Samples)
SampleMeans #show the means of the samples generated
####################################################
#code to plot means of the sampling distribution
#####################################################
plot(density(SampleMeans),
main = “Density of Sample Means”,
xlab = “Sample Mean”)
The plot of the distribution of the sample means is shown below.

<Screenshot can be viewed in the PDF version of this document>

V. Sample Program: Rlytic
Here is the same code with the plot of the results for the Rlytic app on my Android 16 tablet. For brevity I have not included all the hashtag dialog from the RPi example. The screenshot and plot are shown.
#population; sd=10; mean=65
#generate 25 samples of 25 observations
#calculate sample mean of each sample and plot distribution
Samples <- replicate(25, rnorm(25, mean=65, sd=10))
#Samples
SampleMeans <- colMeans(Samples)
#SampleMeans
plot(density(SampleMeans),
main = “Density”,
xlab = Mean”)
The Rlytic Screen:

<Screenshot can be viewed in the PDF version of this document>

The Rlytic Plot: (Note Rlytic graphs are PDF format)

<Screenshot can be viewed in the PDF version of this document>

VI. Sample Program: WebR for iPhone
Here is a slightly modified version of the random sampling code entered into WebR on my iPhone 12.
x=rnorm(25, mean=65, sd=10)
plot(density(x))
Shown below is the resulting output. As in previous examples I did not print the output showing the randomly generated individual means.

<Screenshot can be viewed in the PDF version of this document>

I am still working on the next part of my tutorial on using wordcloud and related packages for the analysis of large, complex text files. Please look for my next post in the not-too-distant future.
D.M. Wiig
R Statistics and Programming
https://dmwiig.net

R For Beginners: Basic Graphics Code to Produce Informative Graphs, Part Two, Working With Big Data


R for beginners: Some basic graphics code to produce informative graphs, part two, working with big data

A tutorial by D. M. Wiig

In part one of this tutorial I discussed the use of R code to produce 3d scatterplots. This is a useful way to produce visual results of multi- variate linear regression models. While visual displays using scatterplots is a useful tool when using most datasets it becomes much more of a challenge when analyzing big data. These types of databases can contain tens of thousands or even millions of cases and hundreds of variables.

Working with these types of data sets involves a number of challenges. If a researcher is interested in using visual presentations such as scatterplots this can be a daunting task. I will start by discussing how scatterplots can be used to provide meaningful visual representation of the relationship between two variables in a simple bivariate model.

To start I will construct a theoretical data set that consists of ten thousand x and y pairs of observations. One method that can be used to accomplish this is to use the R rnorm() function to generate a set of random integers with a specified mean and standard deviation. I will use this function to generate both the x and y variable.

Before starting this tutorial make sure that R is running and that the datasets, LSD, and stats packages have been installed. Use the following code to generate the x and y values such that the mean of x= 10 with a standard deviation of 7, and the mean of y=7 with a standard deviation of 3:

##############################################
## make sure package LSD is loaded
##
library(LSD)
x <- rnorm(50000, mean=10, sd=15)   # # generates x values #stores results in variable x
y <- rnorm(50000, mean=7, sd=3)    ## generates y values #stores results in variable y
####################################################

Now the scatterplot can be created using the code:

##############################################
## plot randomly generated x and y values
##
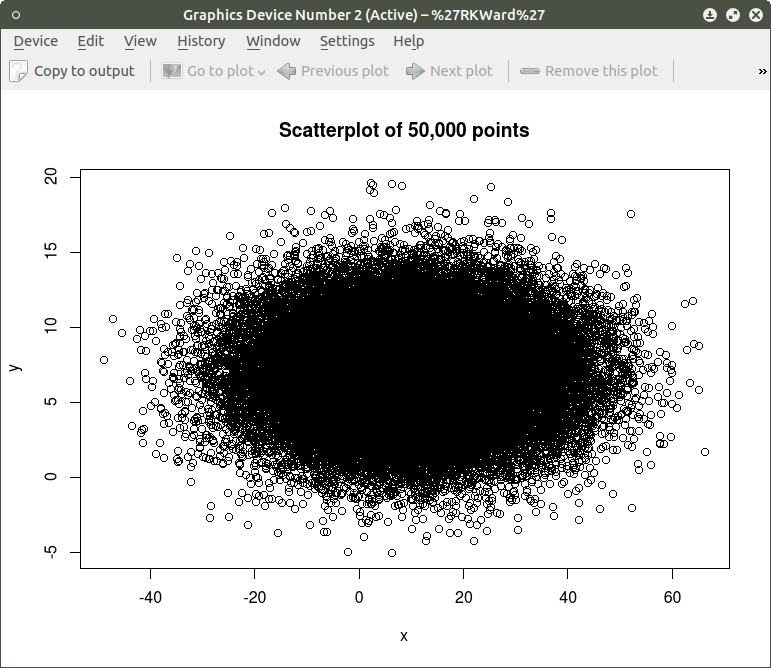
plot(x,y, main=”Scatterplot of 50,000 points”)
####################################################

screenshot-graphics-device-number-2-active-%27rkward%27

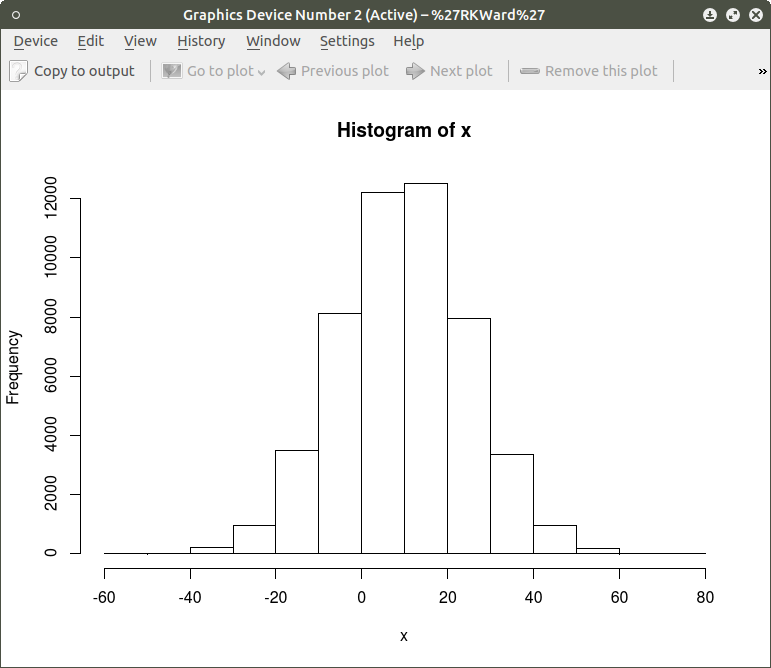
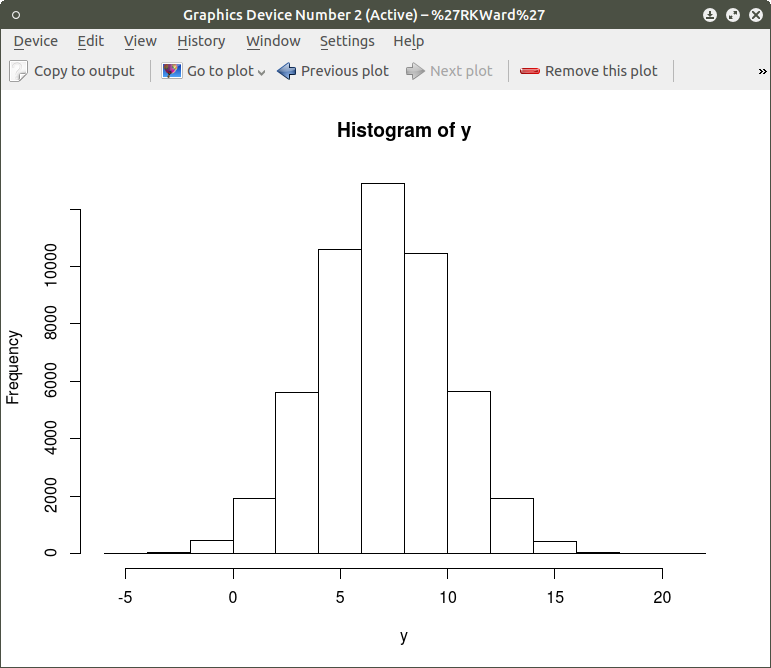
As can be seen the resulting plot is mostly a mass of black with relatively few individual x and y points shown other than the outliers.  We can do a quick histogram on the x values and the y values to check the normality of the resulting distribution. This shown in the code below:
####################################################
## show histogram of x and y distribution
####################################################
hist(x)   ## histogram for x mean=10; sd=15; n=50,000
##
hist(y)   ## histogram for y mean=7; sd=3; n-50,000
####################################################

screenshot-graphics-device-number-2-active-%27rkward%27-5

screenshot-graphics-device-number-2-active-%27rkward%27-4

The histogram shows a normal distribution for both variables. As is expected, in the x vs. y scatterplot the center mass of points is located at the x = 10; y=7 coordinate of the graph as this coordinate contains the mean of each distribution. A more meaningful scatterplot of the dataset can be generated using a the R functions smoothScatter() and heatscatter(). The smoothScatter() function is located in the graphics package and the heatscatter() function is located in the LSD package.

The smoothScatter() function creates a smoothed color density representation of a scatterplot. This allows for a better visual representation of the density of individual values for the x and y pairs. To use the smoothScatter() function with the large dataset created above use the following code:

##############################################
## use smoothScatter function to visualize the scatterplot of #50,000 x ## and y values
## the x and y values should still be in the workspace as #created  above with the rnorm() function
##
smoothScatter(x, y, main = “Smoothed Color Density Representation of 50,000 (x,y) Coordinates”)
##
####################################################

screenshot-graphics-device-number-2-active-%27rkward%27-6

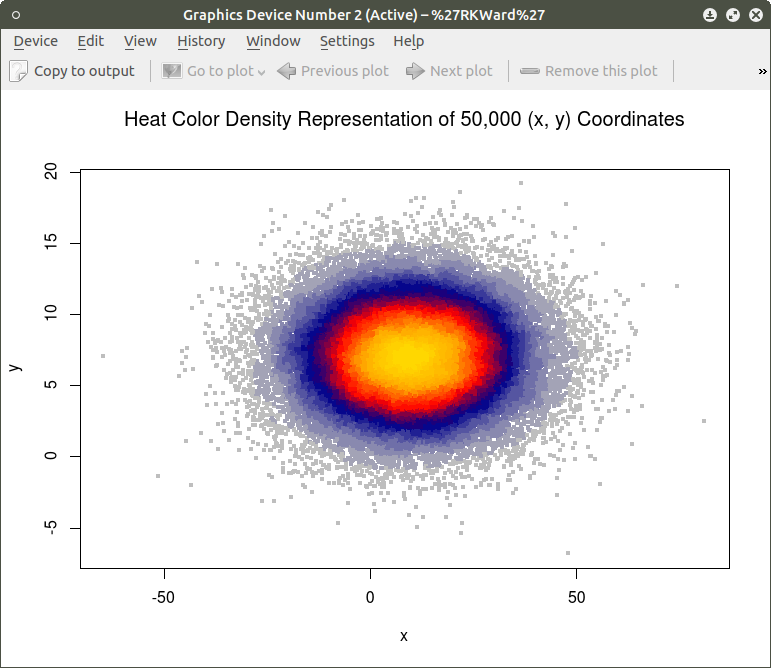
The resulting plot shows several bands of density surrounding the coordinates x=10, y=7 which are the means of the two distributions rather than an indistinguishable mass of dark points.

Similar results can be obtained using the heatscatter() function. This function produces a similar visual based on densities that are represented as color bands. As indicated above, the LSD package should be installed and loaded to access the heatscatter() function. The resulting code is:

##############################################
## produce a heatscatter plot of x and y
##
library(LSD)
heatscatter(x,y, main=”Heat Color Density Representation of 50,000 (x, y) Coordinates”) ## function heatscatter() with #n=50,000
####################################################

screenshot-graphics-device-number-2-active-%27rkward%27-7

In comparing this plot with the smoothScatter() plot one can more clearly see the distinctive density bands surrounding the coordinates x=10, y=7. You may also notice depending on the computer you are using that there is a noticeably longer processing time required to produce the heatscatter() plot.

This tutorial has hopefully provided some useful information relative to visual displays of large data sets. In the next segment I will discuss how these techniques can be used on a live database containing millions of cases.

R For Beginners: Installing the JGR GUI On a Linux Platform


A Tutorial by D. M. Wiig

This is an embedded Word document.  To view it full screen click on the icon in the lower right cornet of the document.

Watch for more tutorials discussing  R statistics on a Linux platform.

How to Install the Latest Version of R Statistics on Your Raspberry Pi


R for Beginners:  How to Install the Latest Version of R Statistics on Your Raspberry Pi

A tutorial by D. M. Wiig

One of the nice characteristics of open source software such as R is the rapid development of new releases and updates.  While the base core remains stable for a period of time there is a considerable amount of updating,  adding, and removing the component packages.  At the time of this writing the latest iteration is R version 3.3.1, “Bug in Your Hair.” If you are using a Windows platform you will likely go directly to the archive web site and download the latest distribution as a Windows executable installation package.

If you are using a Linux distribution  such as Ubuntu or Debian, the process of adding software is usually accomplished via the menu based installer.  These software installers allow  R and its dependencies to be downloaded from the community archive.

One of the disadvantages of using this approach is that the versions of some software in the community archives may not be updated to the latest version.  This is often the case with R as well as with many other software packages.

To insure that you are downloading the latest R version you need to use the platform’s command line to install what is needed.  You can add the URL’s of some backport archives that are more likely to be kept up to date with current releases.  As an example In this tutorial I will use the R statistical software that I am running on my Raspberry Pi 3 board with a Raspbian OS and the new PIXEL desktop.

Regardless of which Linux distribution you are using first open a command console from the desktop menu. Make sure all is up to date by using the command:

pi@raspberrypi:~ $ sudo apt-get update
This will insure all appropriate packages currently installed are running the latest updates.  If you are running a Raspbian distribution such as jessie you will need to edit the /etc/apt/sources.list file to add a backport to the latest version of R.  Start the nano editor by using the command:

sudo nano /etc/apt/sources.list

This should produce the output as seen below:

pi@raspberrypi:~ $ sudo nano /etc/apt/sources.list

------------------------------------------------
GNU nano 2.2.6 File: /etc/apt/sources.list

deb http://mirrordirector.raspbian.org/raspbian/ jessie main contrib non-free r$
# Uncomment line below then 'apt-get update' to enable 'apt-get source'
deb-src http://archive.raspbian.org/raspbian/ jessie main contrib non-free rpi
deb http://archive.raspbian.org/raspbian/ stretch main
deb http://mirror.las.iastate.edu/CRAN/bin/linux/debian/ jessie main
deb http://mirror.las.iastate.edu/CRAN/bin/linux/ubuntu xenial/

[ Read 8 lines ]
^G Get Help ^O WriteOut ^R Read File ^Y Prev Page ^K Cut Text ^C Cur Pos
^X Exit ^J Justify ^W Where Is ^V Next Page ^U UnCut Text^T To Spell

As is seen above there are several lines containing the standard  Raspbian archives to search.


If you are using a Debian distribution you would add the following line to the file:

http://mirror.las.iastate.edu/CRAN/bin/linux/debian/ jessie main

Replace the 'jessie' portion with the name of the specific Debian distribution you are using replace the 'mirror' portion with the R CRAN mirror that you use.  You also need to add the line that provides the URL of a Raspian 'stretch' archive that contains the most recent updates of many different software packages.  In my case I was looking for the latest R release, but you should search this this archive for the latest version of any software package you are installing.

If you are using an Ubuntu distribution add a line with the appropriate changes for the specific Ubuntu distribution that you are using. 
Check with the documentation provided with your specific Linux distribution to see if there is also a 'stretch' archive maintained for new versions. 

Once these changes are made exit the nano editor using the ^O key command to write the file and then the ^X key command to return to the command line.  You should now be able to issue the command:

pi@raspberrypi:~ $ sudo apt-get install r-base r-base-core r-base-dev

Once the download and install processes have completed you should now be able to invoke R from the command line or menu and see the latest version:

pi@raspberrypi:~ $ R

R version 3.3.2 RC (2016-10-23 r71578) -- "Sincere Pumpkin Patch"
Copyright (C) 2016 The R Foundation for Statistical Computing
Platform: arm-unknown-linux-gnueabihf (32-bit)

R is free software and comes with ABSOLUTELY NO WARRANTY.
You are welcome to redistribute it under certain conditions.
Type 'license()' or 'licence()' for distribution details.

 Natural language support but running in an English locale

R is a collaborative project with many contributors.
Type 'contributors()' for more information and
'citation()' on how to cite R or R packages in publications.

Type 'demo()' for some demos, 'help()' for on-line help, or
'help.start()' for an HTML browser interface to help.
Type 'q()' to quit R.

> 


For other Linux distributions you would add a line similar to the above examples in the /etc/apt/sources.list. Check the documentation for your specific Linux platform for further information about backport archives.

R For Beginners: Installing the latest version of R on a Linux platform


R for Beginners:  Installing the latest version of R on a Linux platform

A tutorial by D. M. Wiig

One of the nice characteristics of open source software such as R is the rapid development of new releases and updates.  While the base core remains stable for a period of time there is a considerable amount of updating,  adding, and removing the component packages.  At the time of this writing the latest iteration is R version 3.3.1, “Bug in Your Hair.” If you are using a Windows platform you will likely go directly to the archive web site and download the latest distribution as a Windows executable installation package.

If you are using a Linux distribution  such as Ubuntu or Debian, the process of adding software is usually accomplished via the menu based installer.  These software installers allow  R and its dependencies to be downloaded from the community archive.

One of the disadvantages of using this approach is that the versions of some software in the archives may not be updated to the latest version.  This is often the case with R.

To insure that you are downloading the latest R version you need to use the platform’s command line to install what is needed.  Regradless of which Linux distribution you are using first open a command console from the desktop menu. Make sure all is up to date by using the command:

pi@raspberrypi:~ $ sudo apt-get update
This will insure all appropriate packages currently installed are running the latest updates.  If you are running a Debian distribution such as jessie you will need to edit the /etc/apt/sources.list file to add a backport to the latest version of R.  Use the nano editor by using the command:

sudo nano /etc/apt/sources.list

This should produce the output as seen below:

pi@raspberrypi:~ $ sudo nano /etc/apt/sources.list

------------------------------------------------
GNU nano 2.2.6 File: /etc/apt/sources.list

deb http://mirrordirector.raspbian.org/raspbian/ jessie main contrib non-free r$
# Uncomment line below then 'apt-get update' to enable 'apt-get source'
deb-src http://archive.raspbian.org/raspbian/ jessie main contrib non-free rpi
deb http://archive.raspbian.org/raspbian/ stretch main
deb http://mirror.las.iastate.edu/CRAN/bin/linux/debian/ jessie main
deb http://mirror.las.iastate.edu/CRAN/bin/linux/ubuntu xenial/

[ Read 8 lines ]
^G Get Help ^O WriteOut ^R Read File ^Y Prev Page ^K Cut Text ^C Cur Pos
^X Exit ^J Justify ^W Where Is ^V Next Page ^U UnCut Text^T To Spell


If you are using a Debian distribution you would add the line to the file

http://mirror.las.iastate.edu/CRAN/bin/linux/debian/ jessie main

Replace the mirror portion with <URL of your favorite CRAN mirror>.  Replace the 'jessie' portion with the name of the specific Debian distribution you are using.

If you are using an Ubuntu distribution add a line with the appropriate changes for the specific Ubuntu distribution that you are using.

Once these changes are made exit the nano editor using the ^O key command to write the file and then the ^X key command to return to the command line.  You should now be able to issue the command:

pi@raspberrypi:~ $ sudo apt-get install r-base r-base-core r-base-dev

Once the download and install processes have completed you should now be able to invoke R from the command line or menu and see the latest version:

pi@raspberrypi:~ $ R

R version 3.3.2 RC (2016-10-23 r71578) -- "Sincere Pumpkin Patch"
Copyright (C) 2016 The R Foundation for Statistical Computing
Platform: arm-unknown-linux-gnueabihf (32-bit)

R is free software and comes with ABSOLUTELY NO WARRANTY.
You are welcome to redistribute it under certain conditions.
Type 'license()' or 'licence()' for distribution details.

 Natural language support but running in an English locale

R is a collaborative project with many contributors.
Type 'contributors()' for more information and
'citation()' on how to cite R or R packages in publications.

Type 'demo()' for some demos, 'help()' for on-line help, or
'help.start()' for an HTML browser interface to help.
Type 'q()' to quit R.

> 


For other Linux distributions you would add a line similar to the above examples in the /etc/apt/sources.list. Check the documentation for your specific Linux platform for further information.


R For Beginners: Installing and Using the R Console in a Windows Environment


An R tutorial by D. M. Wiig

This tutorial is posted as an embedded Word document. To view the document full screen click on the icon in the lower-right corner of the document window.

My next post covering installing and using the Rcommander GUI will be out in a day or two.

Peppermint 6 OS is one Sweet Platform


I have spent the past week or two working with Peppermint operating system  v. 6.  This is an operating system that is a hybrid with Google’s Chrome operating system integrated with an Ubuntu platform.  Peppermint OS provides a fast easy to use GUI and is optimized for using Google based cloud tools.

The idea is to keep the clutter to a minimum on the home computer and utilize the cloud to advantage with the numerous Google tools and applications that are available.  Of course, Peppermint OS is free and open source.  The degree of customization possible is only limited by the users imagination and programming abilities.

I will write more on this later as I  utilize more of the programs features.  Check out the Peppermint OS web site at:

http://www.peppermintos.com


How To: Download and install the latest version or R on your Linux Ubuntu OS


How To: Download and install the latest version or R on your Linux Ubuntu OS

(A Tutorial by D.M. Wiig)

I have several computers that use Linux operating systems and I have installed R on all of them. I use Debian on some of the machines and Ubuntu on others. When downloading R using the distribution’s package manager or from the command line I have notice that I will get versions of R ranging from 2.13.xx to 2.15.xxx depending on the Linux distribution. That has not been a problem until the release of the current version of R, version 3.0.3. Since this version is not backwards compatible with earlier releases it is necessary to upgrade to the new version to take advantage of new packages that are rapidly being developed as well as modification to existing packages to accommodate R 3.0.3. This tutorial will cover the installation of R 3.0.3 on the Ubuntu distribution of Linux.

When installing R 3.0.3 it is necessary to make sure that the current binaries are installed to your version of the Linux OS. If you are running a Ubuntu distribution you can edit the sources.list file on your computer to access the most up to date CRANs. Open a terminal program and enter the following from the command line:

$ cd /etc/apt/

$ dir

Make sure the file sources.list is in the directory and then edit the file opening the nano editor:

$ sudo nano sources.list

You should see a file in the editor that is similar to the file shown below:

—————————————————————————————————-

deb cdrom:[Kubuntu 11.10 _Oneiric Ocelot_ – Release i386 (20111012)]/ oneiric main restricted

deb http://streaming.stat.iastate.edu/CRAN/bin/linux/ubuntu precise/

# See http://help.ubuntu.com/community/UpgradeNotes for how to upgrade to

# newer versions of the distribution.

deb http://us.archive.ubuntu.com/ubuntu/ precise main restricted

deb-src http://us.archive.ubuntu.com/ubuntu/ precise main restricted

## Major bug fix updates produced after the final release of the

## distribution.

deb http://us.archive.ubuntu.com/ubuntu/ precise-updates main restricted

deb-src http://us.archive.ubuntu.com/ubuntu/ precise-updates main restricted

## N.B. software from this repository is ENTIRELY UNSUPPORTED by the Ubuntu

## team. Also, please note that software in universe WILL NOT receive any

## review or updates from the Ubuntu security team.

deb http://us.archive.ubuntu.com/ubuntu/ precise universe

deb-src http://us.archive.ubuntu.com/ubuntu/ precise universe

deb http://us.archive.ubuntu.com/ubuntu/ precise-updates universe

deb-src http://us.archive.ubuntu.com/ubuntu/ precise-updates universe

## N.B. software from this repository is ENTIRELY UNSUPPORTED by the Ubuntu

^G Get Help ^O WriteOut ^R Read File ^Y Prev Page ^K Cut Text ^C Cur Pos

^X Exit ^J Justify ^W Where Is ^V Next Page ^U UnCut Text ^T To Spell

—————————————————————————

I have highlighted the line that I added to this file. This line will force Linux to access the CRAN for the latest version of R in a library that is not normally searched for updates if you have an earlier version of R installed. For an Ubuntu distribution change the line to one of the following depending on the distribution that you have installed:

http://<myfavorite-cran-mirror&gt; /bin/linux/ubuntu saucy/

http://<myfavorite-cran-mirror&gt; /bin/linux/ubuntu quantal/

http://<myfavorite-cran-mirror&gt; /bin/linux/ubuntu precise/

http://<myfavorite-cran-mirror&gt; /bin/linux/ubuntu lucid/

Replace <myfavorite-cran-mirror> with the CRAN repository of your choice found at the web site http://cran.r.project.org/mirrors.html. In my case as shown above I used a CRAN repository here in Iowa at Iowa State University. Once the line has been entered in your sources.list file press ctrl-o to save the file, and press ctrl-x to exit the editor. Be sure when you invoke nano that you have root privileges (by using sudo nano) or you will not be able to write out the modified file.

Once you have successfully modified the sources.list file proceed with the R 3.0.3 installation by issuing the command:

$ sudo apt-get update (to make sure all supporting files are current)

and then:

$ sudo apt-get install r-base

When the update runs you should see that R 3.0.x is downloaded and is being installed. After the installation is complete test it by issuing the command:

$ R

You will see the output as shown below:

———————————————

R version 3.0.3 (2014-03-06) — “Warm Puppy”

Copyright (C) 2014 The R Foundation for Statistical Computing

Platform: i686-pc-linux-gnu (32-bit)

R is free software and comes with ABSOLUTELY NO WARRANTY.

You are welcome to redistribute it under certain conditions.

Type ‘license()’ or ‘license()’ for distribution details.

Natural language support but running in an English locale

R is a collaborative project with many contributors.

Type ‘contributors()’ for more information and

‘citation()’ on how to cite R or R packages in publications.

Type ‘demo()’ for some demos, ‘help()’ for on-line help, or

‘help.start()’ for an HTML browser interface to help.

Type ‘q()’ to quit R.

>

You are now up and running with the latest version of R. The process for installation of R 3.0.x is similar for Debian and Fedora distributions. Each of these will be covered in a future tutorial.