
Ternary Diagrams Using R: The ggtern Package
A tutorial by Douglas M. Wiig
There are a number of very useful and popular graphics packages available for R such as lattice, ggplot, ggplot2 and others. Some of these offer general purpose graphics capabilities and others are more specialized. A recently developed extension to the ggplot2 package is ggtern. This package is essentially a wrapper for a number of functions that can be used to create a variety of ternary diagrams. Ternary diagrams are useful when analyzing the relationship among three factors or elements. A ternary diagram essentially represents the proportions of three related factors in two-dimensional space.
Before running the script in this tutorial make sure that the packages ggplot, ggplot2, and ggtern are loaded into your R environment. A basic graph can be easily constructed. I will the use theoretical quantities Xa , Xb , and Xc to demonstrate a basic ternary diagram. In this simple example I will create a sample of n=5 by entering the data from the keyboard into a data frame ‘sampfile.’ To invoke the editor use the following code:
################################################### #create a sample file of n=5 ################################################### sampfile <-data.frame(Xa=numeric(0),Xb=numeric(0),Xc=numeric(0)) sampfile <-edit(sampfile) ###################################################
This will open up a data entry sheet with three columns labeled Xa, Xb, and Xc. The number that are entered do not matter for purposes of this illustration. The table I entered is as follows:
Xa Xb Xc
1 100 135 250
2 90 122 210
3 98 144 256
4 100 97 89
5 90 75 89
To produce a very basic ternary diagram with the above data set use the command:
################################################## #do basic graph with sample data ################################################## ggtern(data=sampfile,aes(x=Xa,y=Xb, z=Xc))+geom_point() ##################################################
This produces the graph seen below:
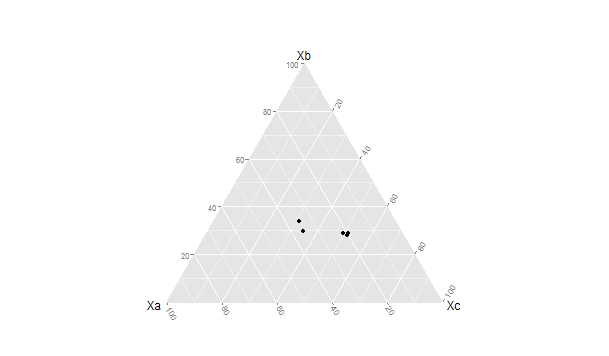
As can be seen the triangular representation of the dimensions Xa →Xb, Xc → Xa and Xb →Xc allow each case to be represented as a single point located relative to each of the three vectors. There are a large number of additions, modifications and tweaks that can be done to this basic pattern.
In the next tutorial I will discuss generating a more elaborate ternary diagram using election outcome data from British general elections. For more information about the ggtern package see the CRAN documentation and information as well as the web site http://www.ggtern.com for all of the latest news and developments.
